Switching between Prometheus servers in Grafana using data source variables

Switching between Prometheus servers in Grafana using data source variables

  • August 3, 2019
Table of Contents

Switching between Prometheus servers in Grafana using data source variables

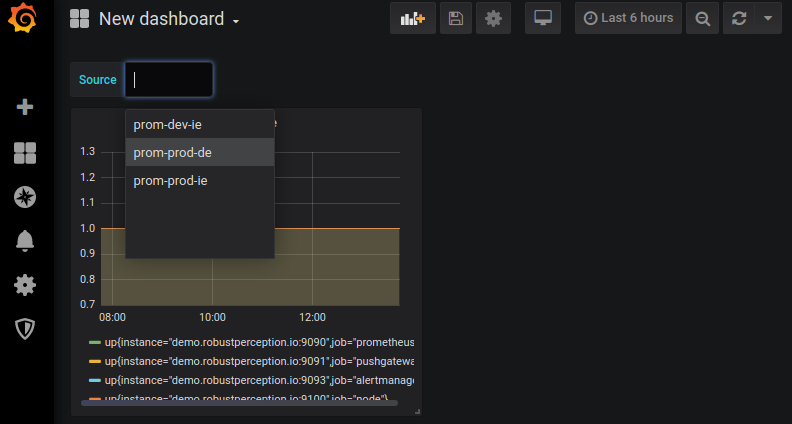
Variables in Grafana (previously known as templates) allow parameterisation of a dashboard via a drop-down menu. Often this is used to switch between machines or services, so that you can have per-machine dashboards without needing to create a dashboard every time a new machine appears. They’re also stored in URL parameters, so could be linked from alert notifications or wiki pages.

Source: robustperception.io

Share :
comments powered by Disqus

Related Posts

Optimising Prometheus 2.6.0 Memory Usage with pprof

Optimising Prometheus 2.6.0 Memory Usage with pprof

There have been some reportsthat compaction was causing larger memory spikes than was desirable. I dug into this and improved it for Prometheus 2.6.0, so let’s see how. Firstly I wrote a test setup that created some samples for 100k time series, in a way that would require compaction.

Read More
How much disk space do Prometheus blocks use?

How much disk space do Prometheus blocks use?

Memory for ingestion is just one part of the resources Prometheus uses, let’s look at disk blocks. Every 2 hours Prometheus compacts the data that has been buffered up in memory onto blocks on disk. This will include the chunks, indexes, tombstones, and various metadata.

Read More
Grafana v6.0 Released

Grafana v6.0 Released

Grafana v6.0 brings many new and exciting features and enhancements and at the same time includes a new React platform and architecture for panels & plugins that will fundamentally change Grafana’s future as a platform. Grafana’s dashboard UI is all about building dashboards for visualization. Explore strips away all the dashboard and panel options so that you can focus on the query & metric exploration.

Read More